How to Use Game Data for Betting Decisions

Betting data analysis is the practice of applying statistical game metrics and market odds comparison to identify wagers with positive expected value (+EV). Bettors who use game data for betting decisions consistently outperform those who rely on gut instinct, because data removes the emotional noise that distorts judgment. The core principle is simple: find situations where your calculated probability of an outcome exceeds the probability implied by the sportsbook's odds. Predictive analytics for betting draws on head-to-head records, team efficiency ratings, rest advantages, and line movements. This guide covers which data matters, how to collect and model it, and how to size bets so you stay in the game long enough to profit.
What game data actually predicts betting outcomes?
Not all game data carries equal weight. Research on NBA game prediction shows that head-to-head records improve forecast accuracy (Brier score impact: +0.010), team statistics add further signal (+0.007), while YouTube sentiment actively harms prediction accuracy (Brier score: -0.017). That last number is the one most betterers ignore. Social media noise does not just fail to help. It makes your model worse.
The Brier score measures forecast accuracy on a 0 to 1 scale, where lower is better. A positive Brier score impact means the variable reduces error. A negative impact means it adds error. YouTube sentiment's -0.017 score means including it in a model produces predictions that are measurably less accurate than ignoring it entirely.
Metrics with proven predictive value:
- Head-to-head records between specific teams
- Team offensive and defensive efficiency ratings
- Rest days and travel schedules (back-to-back games, cross-country travel)
- Recent line movement from sharp sportsbooks
- Home/away splits over a full season sample
Metrics that introduce noise:
- Social media sentiment and fan discussion volume
- Injury reports without context on player role or replacement quality
- News and media narratives that lack historical predictive backing
- Recency bias metrics based on one or two game samples
Pro Tip: Focus on metrics with at least a full season of historical data behind them. A three-game winning streak tells you almost nothing. A team's efficiency differential over 60 games tells you a great deal.
How do you collect and analyze game data effectively?
The foundation of any data-driven betting approach is reliable data sourced from the right places. Official sports APIs (such as those from major league data providers), historical game databases, and sportsbook odds feeds each serve a different purpose. Official APIs give you raw game stats. Historical databases let you backtest patterns. Odds feeds show you where the market currently prices each outcome.
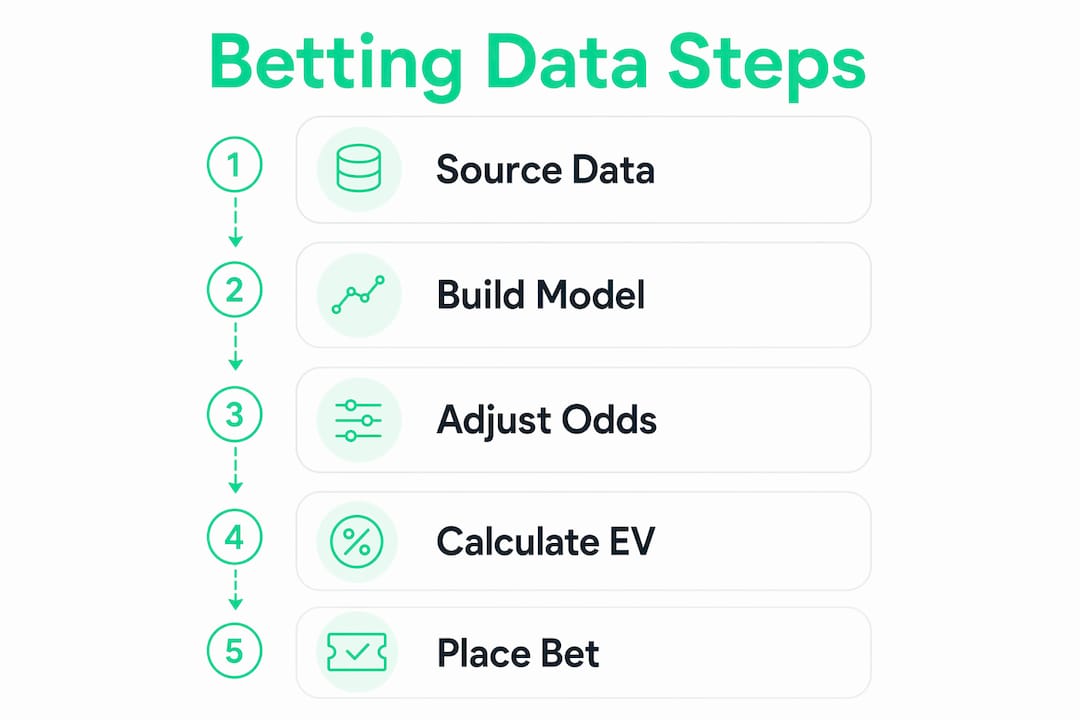
Once you have data, the goal is to build a win probability model. The model converts raw stats into a single number: the probability that Team A beats Team B. You then compare that probability to the sportsbook's implied probability to find edges.
A critical step most bettors skip: removing the sportsbook's vig before comparing odds. Sportsbooks build a margin into every line. Ignoring the vig inflates your estimated edge and leads you to bet on lines where no real edge exists. To strip the vig, convert both sides of a two-way market to implied probabilities, note that they sum to more than 100%, and scale each down proportionally until they sum to exactly 100%.

| Data source | Best use | Limitation |
|---|---|---|
| Official sports APIs | Real-time and historical game stats | Subscription cost; requires coding knowledge |
| Historical game databases | Backtesting models and trends | May lag on recent data updates |
| Sportsbook odds feeds | Market probability benchmarks | Vig must be removed before use |
| Sharp book odds (e.g., Pinnacle) | Approximating true market probability | Fewer markets than recreational books |
Weighting odds from sharp sportsbooks more heavily helps approximate true market probability. One practical approach weights sharp book lines three times more than recreational book lines when calculating a consensus fair probability. That weighted average becomes your benchmark.
Pro Tip: You do not need a complex machine learning model to start. A spreadsheet tracking team efficiency, rest days, and head-to-head results can outperform gut instinct immediately. Build complexity only after you validate that your simple model finds real edges.
How do you turn data insights into a betting strategy?
Translating analysis into actual bets requires three things: a clear edge threshold, a bet sizing rule, and emotional discipline. Without all three, even accurate models lose money.
Identifying positive expected value
Betting is fundamentally about managing uncertainty, not predicting winners with certainty. A +EV bet exists when your model assigns a higher probability to an outcome than the sportsbook's vig-free odds imply. For example, if your model says a team has a 55% chance of winning and the vig-free market implies 50%, you have a 5-percentage-point edge. Bet that edge consistently over hundreds of wagers and the math works in your favor.
Sizing bets with fractional Kelly
The Kelly Criterion calculates the theoretically optimal bet size given your edge and the odds. Full Kelly, however, produces large swings that most bettors cannot stomach. Fractional Kelly sizing at 25%–50% of the full Kelly recommendation reduces drawdowns while preserving long-term growth. In practice, professional bettors risk a flat unit of 1%–3% of total bankroll per wager. That range keeps you solvent through losing streaks that are statistically inevitable even with a genuine edge.
Line shopping across sportsbooks
Consistent line shopping improves long-term ROI by 1%–3% without changing a single pick. That improvement comes purely from finding the best available price on a bet you were already going to place. Holding accounts at multiple sportsbooks and checking odds before every bet is the lowest-effort, highest-return habit in sports betting.
The four rules professional bettors follow:
- Set a minimum edge threshold before placing any bet (typically 3%–5% above vig-free market probability).
- Size every bet as a fixed percentage of current bankroll, recalculated weekly.
- Shop at least three sportsbooks before placing any wager.
- Never increase bet size after a losing streak to "catch up."
Discipline in bankroll management and emotional control are the main factors separating professional bettors from recreational ones. The math only works if you let it play out over a large sample without interference.
What mistakes kill data-driven betting strategies?
The most common failure is not bad data. It is misusing good data. Bettors who build solid models still lose money when they make predictable behavioral errors.
The most damaging mistakes:
- Overloading on noisy inputs. Adding social sentiment, injury rumors, and media narratives to a model degrades its accuracy. Stick to metrics with demonstrated historical predictive value.
- Skipping vig removal. Comparing your model's probability directly to raw sportsbook odds overstates your edge. Every comparison must use vig-free probabilities.
- Betting high-confidence picks without validating edge. Confidence in a team winning is not the same as having a +EV bet. A 70% win probability team at -350 odds is often a negative-EV bet.
- Failing to track results. Tracking every bet including date, sport, odds, stake, and result is the only way to calculate true ROI and identify whether your edge is real or a short-term variance spike.
- Chasing losses with larger bets. Emotional decision-making and inconsistent staking are the primary reasons betting strategies fail. A bad week does not invalidate a sound model. Doubling stakes after losses does.
The fix for most of these mistakes is the same: a written betting log reviewed weekly. When you see your actual ROI by sport, bet type, and odds range, patterns become obvious. You stop betting markets where you have no edge and double down on the ones where your model consistently finds value.
Pro Tip: Review your betting log every 30 days. Calculate ROI by market type separately. If one category consistently underperforms, cut it. If another consistently outperforms, investigate why and expand there.
Key Takeaways
Bettors who use game data for betting decisions profit by combining proven predictive metrics, vig-adjusted odds comparison, and disciplined bankroll management across a large sample of wagers.
| Point | Details |
|---|---|
| Focus on predictive metrics | Head-to-head records and team efficiency outperform social sentiment and media narratives. |
| Remove the vig first | Always strip sportsbook margin before comparing market odds to your model's probabilities. |
| Size bets at 1%–3% of bankroll | Flat unit sizing at this range survives variance and keeps you in the game long-term. |
| Shop lines before every bet | Comparing odds across multiple sportsbooks adds 1%–3% ROI without changing your picks. |
| Track every bet you place | A detailed betting log is the only reliable way to confirm whether your edge is real. |
What I've learned about data and discipline in betting
The hardest lesson I've absorbed over years of watching bettors succeed and fail is this: the data is rarely the problem. Most bettors who lose with a data-driven approach lose because of what they do between the model output and the actual bet placement.
I've seen bettors with genuinely accurate models blow their bankrolls because they sized up after a bad week, or because they added one too many "interesting" variables to their model after reading a forum post. Data overload is real. Every variable you add to a model has to earn its place by improving out-of-sample accuracy. If it doesn't, it's noise, and noise costs money.
The other thing I'd push back on is the idea that more sophisticated tools automatically produce better results. A well-maintained spreadsheet tracking rest days, efficiency differentials, and line movement from sharp books beats a poorly calibrated machine learning model every time. Start simple. Validate your edge over at least 200 bets before scaling up. If the edge holds, then add complexity.
Discipline is not a soft skill in this context. It is a mathematical requirement. The Kelly Criterion only works if you apply it consistently. Line shopping only compounds if you do it every single time. The bettors I've seen build sustainable edges treat their process like a system, not a series of individual decisions. That shift in mindset is where the real edge lives.
— Ian
How Stakestats helps you apply game data smarter
Stakestats is built for bettors who want to move beyond guesswork and apply real data to their wagers. The platform provides transparency tools for online gamblers on Stake.com and other provably fair sites, helping you compare fair probabilities to market odds and spot where genuine value exists. Whether you are refining your approach to bankroll management or looking for a clearer view of how game performance metrics translate into betting edges, Stakestats gives you the data layer that most bettors are missing. Pair it with the disciplined staking and line-shopping habits covered here, and you have a complete system built on evidence rather than instinct.
FAQ
What types of game data are most useful for betting?
Head-to-head records, team efficiency ratings, and rest day advantages have the strongest historical predictive value. Social media sentiment and media narratives consistently add noise and reduce model accuracy.
How do I calculate positive expected value from game data?
Convert your model's win probability and the sportsbook's vig-free implied probability into percentages. If your model's probability exceeds the vig-free market probability, the bet has positive expected value.
What is the vig and why does it matter for betting analysis?
The vig is the margin sportsbooks build into every line, causing both sides of a market to sum to more than 100%. Comparing your model directly to raw odds without removing the vig overstates your edge and leads to losing bets.
How much of my bankroll should I bet per game?
Professional bettors risk 1%–3% of total bankroll per wager as a flat unit. This range absorbs losing streaks without wiping out your capital, even when your model has a genuine long-term edge.
Does line shopping really make a difference in sports betting?
Consistent line shopping improves long-term ROI by 1%–3% without changing any picks. That gain compounds significantly over hundreds of bets placed across a full season.