
Keno Odds on Stake: Compute RTP, EV, and Verify Draws

Stake Keno draws 10 numbers from a pool of 40, and every hit probability is fixed by the hypergeometric formula — the operator cannot change the math, only the paytable multipliers that convert those probabilities into payouts. That distinction matters because it splits what you can know in advance (exact odds) from what you need to look up each session (current multipliers and RTP). Three things to do before you stake a single dollar:
- Check the live in-game paytable on Stake's Keno page — multipliers shift by risk level (Classic, Low, Medium, High), so yesterday's numbers may not apply today.
- Plug those multipliers into a Keno calculator such as Kenocalc or the Stakestats IOW calculator to compute RTP and expected value (EV) before you commit a session bankroll.
- Verify every draw using Stake's provably-fair system or the Stakestats provably-fair tool — capture the round ID and server seed hash immediately after the draw.
Set a hard session bankroll limit before you play. GambleAware offers free self-assessment tools if you need help managing play.
Key Takeaways
Stake Keno odds are fixed by the hypergeometric formula on a 40-pool, 10-draw format — the only variable you control is which paytable you play against.
| Point | Details |
|---|---|
| Check the live paytable first | Multipliers shift by risk level (Classic/Low/Medium/High); always pull the current in-game numbers before calculating. |
| Compute RTP before every session | Use RTP = Σ [P(m) × multiplier(m)] to find the real house edge; mid-range hit payouts drive most of the return. |
| Expected hits = n ÷ 4 | On a 40/10 draw, a 4-spot ticket averages 1 hit per round; a 5-spot full match hits roughly 1 in 2,620 rounds. |
| Verify draws with provably-fair tools | Capture round ID and server seed hash immediately after each round; use the Stakestats provably-fair verifier to confirm results. |
| Stakestats for full analytics | The Stakestats Stake Engine analyzer, bankroll analyzer, and IOW calculator cover RTP modeling, variance simulation, and draw verification in one place. |
Table of Contents
- What do Stake Keno rules actually mean for your odds?
- How do you calculate exact Keno odds on Stake?
- Hit-distribution tables for 1–5 spot tickets
- How do you convert a Stake paytable into RTP and house edge?
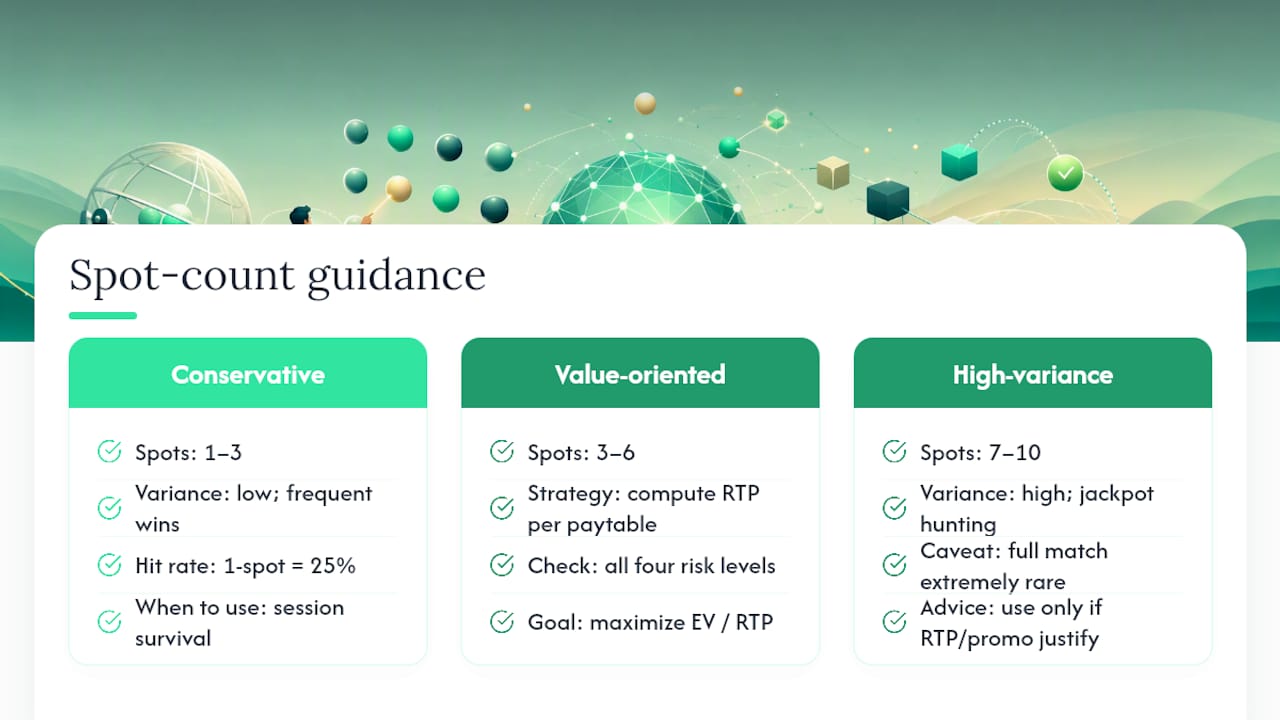
- Which spot count gives you the best practical odds on Stake?
- Practical bankroll rules for Keno sessions on Stake
- How do you verify a Stake Keno draw is provably fair?
- Which calculators and tools should you actually use?
- An editorial note on math-first Keno analysis
- Stakestats gives you the Keno math without the guesswork
- Sources
What do Stake Keno rules actually mean for your odds?
Stake Keno is a Stake Originals title built on a fixed mechanical structure: a pool of 40 numbers, 10 drawn per round, and a ticket where you pick between 1 and 10 spots. Those three parameters are the only inputs the probability formula needs. The paytable — the multiplier you receive for matching m of your n chosen spots — is the operator-controlled layer on top.
A few terms worth pinning down before the math:
Spot — how many numbers you select on your ticket (1 through 10). Hit — a match between one of your spots and one of the 10 drawn numbers. Paytable / multiplier — the payout ratio for each hit count, set by Stake and adjustable via the risk-level setting. Ticket stake — the dollar (or crypto) amount you wager on a single round. Risk level — Stake's four settings (Classic, Low, Medium, High) that shift multiplier distributions; independent reviews confirm that higher risk levels compress small-hit payouts and inflate the top multiplier. Provably fair draw — a cryptographic system where the draw outcome is determined by a server seed (hashed in advance) and a client seed, making post-hoc manipulation detectable. Expected hits — on a 40-pool, 10-draw game, the average number of hits for an n-spot ticket is n × 10/40 = n/4. Pick 4 spots, expect 1 hit on average. Pick 8, expect 2.
The flow is simple: choose your spots and stake amount, the round draws 10 numbers, matches are counted, and the paytable converts that match count into a payout. The probabilities never change. The multipliers do.
How do you calculate exact Keno odds on Stake?
The hypergeometric formula gives the exact probability of matching exactly m of your n chosen spots when 10 numbers are drawn from a pool of 40:
P(m hits | n spots) = C(n, m) × C(40 − n, 10 − m) / C(40, 10)
Each term in plain language:
- C(n, m) — the number of ways to choose m hits from your n spots (the "good" draws).
- C(40 − n, 10 − m) — the number of ways the remaining 10 − m drawn numbers come from the 40 − n numbers you did not pick.
- C(40, 10) — the total number of ways to draw any 10 numbers from 40, which equals 850,668,000. This is the denominator that never changes.
The draw is sampling without replacement, which is why the hypergeometric distribution applies rather than a simpler binomial. Once a number is drawn, it cannot appear again in the same round, so each successive draw is from a shrinking pool.
Academic analysis confirms that exact hypergeometric calculations are the appropriate tool for evaluating Keno strategies, with simulation and central-limit-theorem approximations valid for exploring larger spot-count scenarios.
Worked example 1: 1-spot ticket
With n = 1, the only outcomes are 0 hits or 1 hit.
P(1 hit | 1 spot) = C(1,1) × C(39,9) / C(40,10) = 1 × 273,438,880 / 850,668,000 ≈ 0.2500 (25.00%)
Exactly 1 in 4 rounds, on average, your single number gets drawn. Clean and intuitive.
Worked example 2: 5-spot ticket
Hitting all 5 is considerably rarer:
P(5 hits | 5 spots) = C(5,5) × C(35,5) / C(40,10) = 1 × 324,632 / total draws, which is a very small probability.
That is roughly a very rare event. Hitting exactly 3 of 5 is far more common:
P(3 hits | 5 spots) = C(5,3) × C(35,7) / C(40,10) = 10 × 6,724,520 / total draws, giving a moderately low probability.
The probability mass concentrates around the expected hit count (5/4 = 1.25 for a 5-spot ticket), which means most rounds produce 0, 1, or 2 hits. Full matches are rare events, not a reliable income stream. Adding more spots compresses the full-match probability further while shifting the distribution toward middle hit counts.
Hit-distribution tables for 1–5 spot tickets
The table below shows exact probabilities and 1-in-N odds for each possible hit count on 1-spot through 5-spot tickets, using the 40-pool/10-draw format.
Expected hits rule: For any n-spot ticket on Stake Keno, the average number of hits per round = n ÷ 4. A 4-spot ticket averages 1 hit; an 8-spot ticket averages 2. This tells you the center of the distribution, not the payout.
1-spot ticket
| Hits (m) | Probability | Odds (1 in N) |
|---|---|---|
| 0 | 25.00% | 1 in 4 |
| 1 | 25.00% | 1 in 4 |
2-spot ticket
3-spot ticket
4-spot ticket
5-spot ticket
| Hits (m) | Probability | Odds (1 in N) |
|---|---|---|
| 0 | 22.44% | 1 in 4.46 |
| 1 | 40.59% | 1 in 2.46 |
| 2 | 27.42% | 1 in 3.65 |
| 3 | 7.91% | 1 in 12.6 |
| 4 | 0.97% | 1 in 103 |
| 5 | very small | very rare |
Full distributions for 6-spot through 10-spot tickets are available directly on the Keno hit-probability calculator — enter pool = 40, draw = 10, and your spot count to generate the complete table.
How do you convert a Stake paytable into RTP and house edge?
RTP (return to player) is the percentage of every dollar wagered that the game returns over a long run. The formula is:
RTP = Σ [P(m hits) × payout multiplier(m)] / 1
Since you divide by the bet of 1 unit, RTP is simply the sum of (probability × multiplier) across all hit counts. House edge = 1 − RTP.
Step-by-step worked example
Suppose you are playing a 3-spot ticket on Stake's Classic risk level and the in-game paytable shows these multipliers:
RTP = 0.0000 + 0.0000 + 0.2776 + 0.4170 = 0.6946 → 69.46% House edge = 1 − 0.6946 = 30.54%
That is a rough example using illustrative multipliers. The actual multipliers on Stake vary by risk level and can shift. Gamblingcalc's Keno payout analyzer demonstrates that two games with identical mechanics can produce RTPs that differ by 20 or more percentage points depending solely on mid-range hit payouts. The jackpot multiplier barely moves the RTP because the probability of hitting it is so small — it is the 2-hit and 3-hit payouts that do most of the work.
How to run this yourself
- Open Stake Keno and navigate to the in-game paytable for your chosen spot count and risk level.
- Record every multiplier for each hit count (including 0-hit, which is almost always 0×).
- Pull the matching probabilities from the hit-distribution table above or from the calculator.
- Multiply each probability (as a decimal) by its multiplier and sum all products.
- That sum is your RTP. Subtract from 1 for house edge.
Pro Tip: Paste the probabilities and multipliers into a spreadsheet or use Kenocalc with the Stake 40/10 preset — it handles the arithmetic and flags which hit count contributes most to RTP, saving you from a manual error on a 10-spot ticket with 11 rows.
Which spot count gives you the best practical odds on Stake?
The honest answer: whichever spot count produces the highest RTP for the current paytable. There is no universally "best" number of spots — the math changes every time Stake adjusts multipliers or you switch risk levels.
That said, a few patterns hold across most paytables. Fewer spots produce more frequent wins and lower variance. A 1-spot ticket hits 25% of rounds; a 10-spot full match happens roughly once in hundreds of thousands of rounds. PokerNews strategy guidance confirms that picking fewer spots improves raw odds, but paytable-aware EV analysis is the only reliable way to judge whether those frequent small wins actually return more per dollar.
Conservative players (session survival, low variance): 1–3 spots. Wins come often enough to sustain a session. The downside is that top multipliers are modest, so you need a favorable paytable to get RTP above 90%.
Value-oriented players (EV-focused): Compute RTP for 3–6 spots across all four risk levels and pick the combination with the highest result. Mid-range spot counts often have the best balance between hit frequency and multiplier size, and mid-range payouts drive the bulk of RTP.
High-variance players (jackpot hunting): 7–10 spots only make sense when a specific paytable or promotion pushes EV into acceptable territory. The full-match probability on a 10-spot ticket is astronomically small, and most sessions will return nothing from the top tier. Run the RTP calculation first — if the result is below 90%, the jackpot is not compensating for the frequency of zero-payout rounds.
Practical bankroll rules for Keno sessions on Stake
Keno's variance is high even on low-spot tickets, and it compounds quickly on 7–10 spot picks. A few concrete rules keep sessions manageable:
- Set a fixed session bankroll before you open the game — an amount you are genuinely comfortable losing entirely. Do not top it up mid-session.
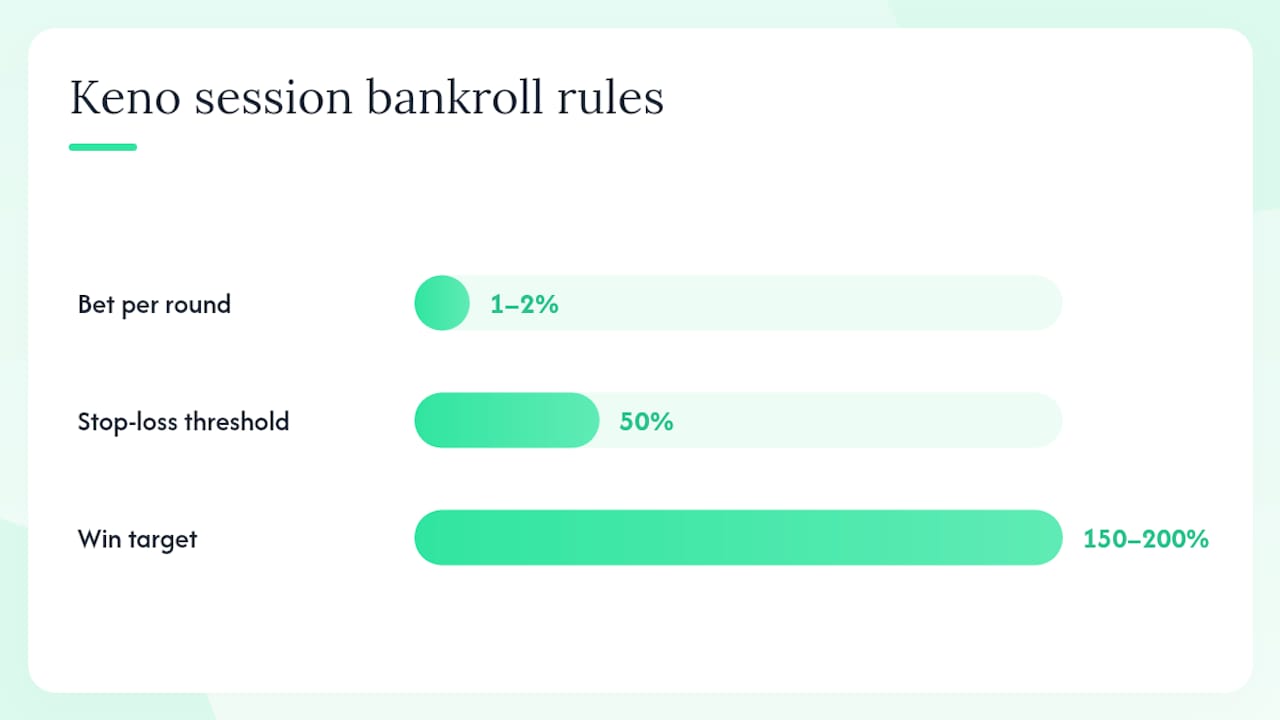
- Cap each bet at 1–2% of your session bankroll. On a $100 session, that means $1–$2 per round. At 1% per round, you get at least 100 rounds of exposure before ruin, which is enough to observe the distribution rather than bust on a cold streak.
- Set a stop-loss at 50% of session bankroll. If you hit it, stop. Chasing losses in a negative-EV game accelerates the damage.
- Set a win target at 150–200% of session bankroll. If you reach it, pocket the profit and either stop or reload with a fresh, smaller session stake. Locking in a win is the only way to leave ahead.
- Never increase bet size to recover losses. Stake size scales payouts linearly but does not change probabilities — doubling your bet after a loss does not improve your odds of winning the next round.
A quick stake-scaling example: if your base bet is $1 and the 5-spot full-match multiplier is 100×, you win $100. At $5 per round, the same hit pays $500. The probability of hitting remains 0.038% either way. Bigger stakes amplify both wins and losses at the same rate.
Pro Tip: Use the Stakestats bankroll analyzer to model worst-run scenarios for your chosen spot count and stake size before committing real money. It shows draw-by-draw variance and how deep a losing streak can realistically go.
GamblingTherapy offers multilingual support and online guidance if you find bankroll limits difficult to maintain in practice.
How do you verify a Stake Keno draw is provably fair?
Provably fair verification lets you independently confirm that a round's outcome was not manipulated after you placed your bet. The process on Stake uses a server seed (hashed before the round), a client seed you can set yourself, and a nonce (round counter).
Step-by-step verification workflow
- Before the round: note your client seed in Stake's fairness settings. You can rotate it at any time; rotating generates a new server seed hash.
- After the round: open the round's fairness panel and record the round ID, the revealed server seed, the client seed, and the nonce.
- Run the verification: paste those values into Stake's built-in verifier or the Stakestats provably-fair tool. The tool re-derives the draw from the seeds and confirms whether the output matches the result you saw.
- Interpret the result: if the derived draw matches the displayed result, the round is confirmed fair. A mismatch is a red flag worth escalating to Stake support with your screenshots.
- Check historical rounds: the Stakestats Stake Engine analyzer lets you look up past rounds by round ID, replay bets, and review RTP and hit-rate stats across your session history.
Pro Tip: Screenshot or copy the server seed hash and round ID immediately after a round you want to dispute or analyze. Once you rotate your client seed, the previous server seed is revealed — but if you did not record the round ID, tracing it later is harder.
The Stakestats transparency tools tie verification directly to the Stake Engine's published mechanics, so you can cross-reference a disputed draw against the documented algorithm rather than relying on Stake's interface alone.
Which calculators and tools should you actually use?
Three tools cover the full workflow from probability to verification:
- Kenocalc — Stake-preset Keno calculator (40/10). Paste in your paytable multipliers, select spot count, and it outputs hit probabilities, EV per bet, and RTP. Best for rapid paytable comparisons across risk levels.
- Provenly Fair Keno Calculator — generates the full hit-distribution table for any pool/draw/spot combination. Use it to extend the 6–10 spot tables beyond what is shown above, or to verify a probability figure before plugging it into an RTP calculation.
- Stakestats tools — the IOW calculator handles paytable/RTP scenarios; the bankroll analyzer models session variance; the provably-fair explainer walks through seed verification step by step; and the Stake Engine analyzer surfaces live RTP, volatility, and hit-rate data for Keno and 2,500+ other Stake Originals.
Always use the live in-game paytable when running any calculation. Multipliers on Stake differ by risk level and can be updated by the operator. A calculation based on last week's paytable may show a completely different RTP than what you are actually playing against.
An editorial note on math-first Keno analysis
Most Keno content online skips the actual math and lands on vague advice like "pick your lucky numbers" or "avoid consecutive spots." Neither has any bearing on the hypergeometric distribution. The only variables that matter are the ones in the formula: pool size, draw size, spot count, and the paytable multipliers that convert probabilities into money.
Analyzing Stake Engine games through Stakestats reinforced one thing consistently: the house edge on Keno is real and often steep, but it is not uniform across spot counts or risk levels. Players who compute RTP before each session — rather than guessing — are working with the same information the operator has. That is not a guarantee of profit; it is the minimum standard for informed play.
Stakestats gives you the Keno math without the guesswork
Most players check the paytable once and never run the numbers. Stakestats closes that gap with tools built specifically for Stake Originals: a provably-fair verifier that re-derives any Keno draw from its seeds, a bankroll analyzer that models worst-run variance before you commit a session stake, and a Stake Engine analyzer that surfaces live RTP and hit-rate data across 2,500+ games.

The difference between a session where you understand your edge and one where you are just hoping is about five minutes with the right calculator. Head to Stakestats to run your paytable through the RTP tool, verify your last draw, and check the bonus code aggregator for promotions that can shift effective EV in your favor.
Sources
- Keno Calculator — Hit Probability & Odds (Stake-Style 2026)
- Keno Calculator — Odds, Payout, RTP & Paytable Analyzer
- Keno Payout Analyzer: Calculate RTP & House Edge for Any Paytable
- Stake Italia | Scommesse Sportive, Slot & Casinò
- How to Play Keno on Stake in July 2026
- Statistical methods for deciding optimal Keno strategies (academic paper)
- Keno Strategy: How to Win at Keno | PokerNews
- Gambleaware
This article is general information about Keno odds and mechanics, not financial or gambling advice. Confirm current paytables and rules directly on Stake.com, and consult a qualified professional or the resources above if gambling is causing harm.