
Risk of Ruin Explained: The Math Behind Going Broke

Risk of ruin is the probability that you lose your entire bankroll before your edge (or luck) has a chance to pay off. It comes down to three numbers: how much you bet relative to your bankroll, your edge (win rate and payoff ratio), and the variance of your results. The single biggest lever you control is bet size. Cut your risk per bet in half, and in most cases you don't just halve your risk of ruin. You crush it by a much larger factor.
Before doing anything else, check these three things:
- Bet size: What fraction of your total bankroll is on the table for any single bet or trade?
- Edge: What's your actual win rate and payoff ratio, based on real history, not hope?
- Variance: How wild are your results from one outcome to the next?
Key Takeaways
Risk of ruin drops sharply when you cut bet size relative to bankroll, even when your edge and variance stay exactly the same.
| Point | Details |
|---|---|
| Three core inputs | Bet size, edge (win rate and payoff ratio), and variance together determine your risk of ruin. |
| Bet size dominates | Cutting risk per bet from 5% to 1% typically moves RoR from double digits to under 5%. |
| Use real data | Pull win rate and R-multiple from your last 50 to 200 trades or sessions, not assumptions. |
| Recalculate often | Rerun your risk of ruin calculation after any drawdown of 5% or more. |
| Size conservatively | Fractional Kelly (1/4 to 1/2) and avoiding correlated exposure both reduce ruin risk beyond the base formula. |
| Verify with Stakestats | The Stakestats bankroll analyzer and provably fair tools convert raw play logs into the exact inputs risk of ruin calculators need. |
Table of Contents
- Understanding Risk of Ruin: The Core Variables
- How Do You Calculate Risk of Ruin?
- Two Worked Examples: Blackjack and a Trading Journal
- What Does Risk of Ruin Actually Mean for You?
- Strategies to Lower Your Risk of Ruin
- What Should You Feed a Risk of Ruin Calculator?
- Why Most People Get Risk of Ruin Backward
- Track Your Real Risk of Ruin Inputs With Stakestats
- Sources
Understanding Risk of Ruin: The Core Variables
Every risk of ruin calculation rests on three inputs, and getting any one of them wrong throws off the whole number.
Bet size gets expressed as a fraction of bankroll, often called a "risk unit." If you have a $10,000 bankroll and risk $100 per trade, you're risking 1 unit, or 1%. Your bankroll in units, sometimes labeled C, is just bankroll divided by risk per bet.
Edge is your win rate (W) combined with your payoff ratio, or R-multiple, the average size of your wins relative to your average loss. A trader who wins 45% of the time but makes 2.5 times what they lose on average has a very different risk profile than one winning 45% with a 1:1 payoff.
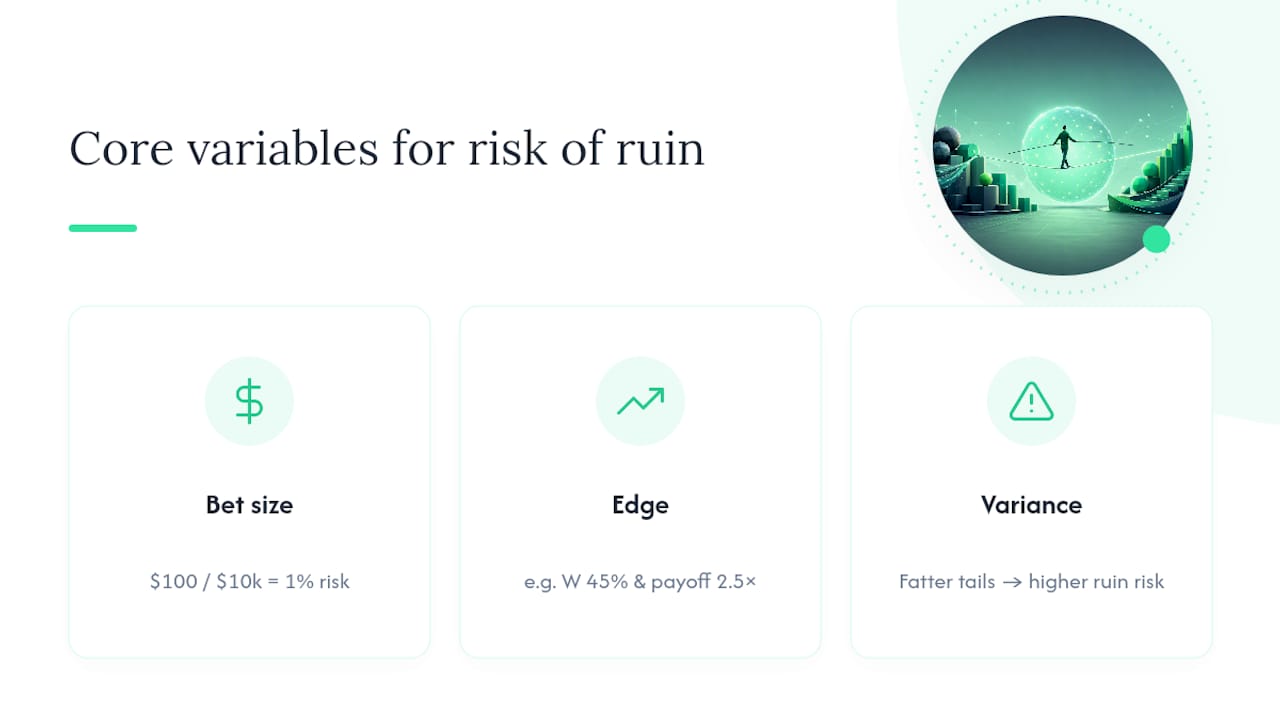
Variance measures how much your results bounce around that average. Two systems with identical long-run edge can have wildly different risk of ruin gambling profiles if one has fatter tails.
Pro Tip: Pull your last 50 to 200 trades or sessions and calculate your actual W and R from that sample. Assumed numbers are almost always more flattering than real ones.
Research on retail trading behavior suggests a large majority of active day traders lose money over a 12-month period, largely because they size positions without ever running this math.
How Do You Calculate Risk of Ruin?
The classic gambler's ruin formula and its modern trading equivalents share the same skeleton: edge, variance, and bankroll units combine into one probability.
- Gather your win rate (W) and payoff ratio (R) from a real sample of trades or bets.
- Compute your bankroll in risk units (C): total bankroll divided by dollars risked per bet.
- Calculate the dimensionless advantage, α = advantage / variance, which normalizes your edge against volatility.
- Apply the ruin formula: for flat-betting scenarios, calculators use RoR = ((1−α)/(1+α))^C, where a smaller α or bigger C pushes RoR toward zero.
- Decide whether you need a finite-horizon or infinite-horizon answer.
| Horizon type | What it measures | Best used for |
|---|---|---|
| Infinite horizon | Ruin probability if play continued forever | Theoretical baseline, worst-case sizing |
| Finite horizon | Ruin probability over a set number of hands, trades, or sessions | Session bankrolls, funded-account challenges, career planning |
The formula assumes constant edge and constant risk per bet. Real edges drift, and real traders resize positions, so treat any single output as a snapshot, not a guarantee.
Two Worked Examples: Blackjack and a Trading Journal
Numbers make this concrete faster than formulas alone.
Gambling example: A card counter with a 1% edge, betting 1 unit per hand out of a 100 unit bankroll, faces a low risk of ruin, often well under 5% depending on bet spread and rules. Drop that edge to 0%, flat game with no advantage, and the same bankroll now faces near-certain long-run ruin if play continues indefinitely. The edge is what separates "grinding profit" from "slow bleed."
Trading example: Say your journal shows a 45% win rate with a 2:1 payoff ratio, a solid positive-expectancy system on paper.
- At 1% risk per trade, risk of ruin calculators typically show RoR under a few percent.
- At 5% risk per trade with the same edge, RoR often jumps into the 10 to 25% range.
- The edge didn't change. Only the bet size relative to bankroll did.
What Does Risk of Ruin Actually Mean for You?
Negative expected value games carry a mathematical certainty of eventual ruin if you play long enough, no exceptions, no lucky escapes over an infinite horizon. That's the gambler's ruin problem in its purest form.
But most of life happens on a finite horizon, not an infinite one, and that distinction matters:
- Variance causes short-term losing streaks even in positive-EV systems; ruin is what happens when a streak outlasts your bankroll.
- A "ruin threshold" doesn't have to mean total wipeout. Prop traders often define ruin as a 50% drawdown or the point where a funded account gets shut down.
- Choosing your threshold before you start playing or trading turns an abstract fear into a concrete number you can size against.
Strategies to Lower Your Risk of Ruin
Position sizing is the lever that moves risk of ruin the most, and it's the one most people ignore until they've already been burned.
- Set a risk-per-trade target. Retail traders often risk 2 to 5% per position; professional traders and advantage players commonly target well under 1% to 5%, sometimes under 1% at prop firms specifically because it keeps RoR in single digits.
- Use fractional Kelly. Full Kelly sizing assumes you know your edge perfectly, which you don't. Using 1/4 to 1/2 Kelly cuts your sensitivity to estimation error without giving up most of the growth.
- Recalculate after drawdowns. Any drawdown of 5% or more should trigger a fresh RoR calculation with updated numbers, not a shrug and a "it'll bounce back."
- Avoid correlated exposure. Five uncorrelated small bets behave very differently than five bets that all lose together. Aggregate exposure across correlated positions raises your real risk of ruin far above what any single-position formula shows.
- Build in behavioral guardrails. No chasing losses, no doubling up after a bad night, no "just this once" sizing. Discipline is the part of the formula no calculator can enforce for you.
Pro Tip: If you can't answer "what's my current risk of ruin?" in under two minutes, your sizing rules are too loose to trust.
What Should You Feed a Risk of Ruin Calculator?
A calculator is only as good as what you put into it, and most people feed it guesses instead of data.
Pull these from a 50 to 200 bet or trade sample before you touch a calculator:
- Win rate (W) and average payoff ratio (R), calculated from actual outcomes, not memory.
- Dollar amount risked per trade or bet, and your current total bankroll.
- Standard deviation of results, if your tool asks for variance directly.
Set the calculator to finite horizon if you're modeling a single session, a funded-account challenge, or a fixed trade count. Use infinite horizon only as a worst-case theoretical check.
Why Most People Get Risk of Ruin Backward
Most explanations of risk of ruin treat it as a math curiosity, something to compute once and file away. That's backward. RoR is a live number that should move every time your win rate, bankroll, or bet size shifts, and treating it as static is exactly how disciplined players end up blindsided.
The bigger blind spot is where people look for the fix. Conventional advice obsesses over finding a better edge, a sharper system, a smarter entry signal. But the math says bet size does more damage, or more good, than a few extra points of edge ever will. That's not intuitive, and it's why so many blown accounts belonged to people who were actually right about their edge.
If there's one habit worth building, it's the recalculation habit. Pull your real numbers every few dozen trades, not once a year. A risk of ruin figure calculated from six-month-old data is closer to fiction than forecast.
— Ian
Track Your Real Risk of Ruin Inputs With Stakestats
Running these formulas by hand works fine for a one-time gut check, but risk of ruin is only useful when you keep it current, and that means pulling fresh numbers from real play logs regularly. Stakestats built its bankroll analyzer specifically to turn raw stake history into the inputs this math actually needs: your effective bet size in bankroll units, your realized volatility, and your win rate over any window you choose, no manual spreadsheet required.

Pair that with Stakestats's provably fair verification tools to confirm the game's real hit rate and volatility match what's advertised before you size against it, since a mismatch there quietly wrecks any RoR estimate built on assumed numbers. If you've had a rough week or a big swing, that's your cue to rerun the analysis, not to keep betting on stale math. Open the bankroll analyzer now and plug in your last session to see where your real risk of ruin stands.